
Note
Go to the end to download the full example code.
Kernel k-means#
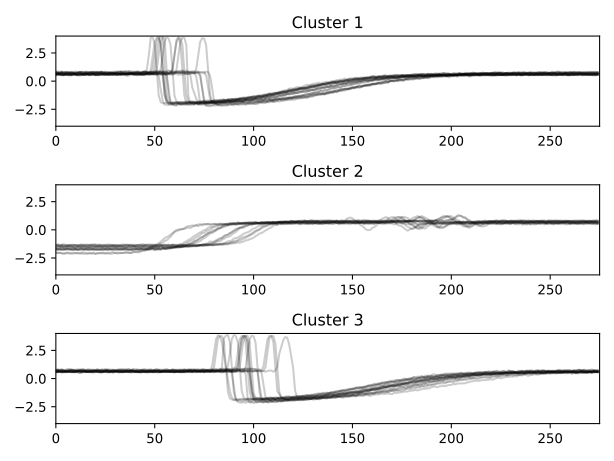
This example uses Global Alignment kernel (GAK, [1]) at the core of a kernel \(k\)-means algorithm [2] to perform time series clustering.
Note that, contrary to \(k\)-means, a centroid cannot be computed when using kernel \(k\)-means. However, one can still report cluster assignments, which is what is provided here: each subfigure represents the set of time series from the training set that were assigned to the considered cluster.
Init 1
69.989 --> 50.555 --> 44.809 --> 39.228 --> 38.525 --> 38.274 --> 38.274 -->
Init 2
73.500 --> 56.163 --> 46.889 --> 38.525 --> 38.274 --> 38.274 -->
Init 3
72.522 --> 58.699 --> 48.879 --> 39.658 --> 38.525 --> 38.274 --> 38.274 -->
Init 4
72.724 --> 48.397 --> 47.367 --> 45.471 --> 40.415 --> 38.274 --> 38.274 -->
Init 5
67.830 --> 49.865 --> 43.579 --> 40.913 --> 39.228 --> 38.525 --> 38.274 --> 38.274 -->
Init 6
69.032 --> 48.300 --> 38.274 --> 38.274 -->
Init 7
73.764 --> 44.286 --> 40.062 --> 39.228 --> 38.525 --> 38.274 --> 38.274 -->
Init 8
70.647 --> 43.591 --> 38.789 --> 38.274 --> 38.274 -->
Init 9
69.114 --> 50.962 --> 46.566 --> 41.645 --> 38.274 --> 38.274 -->
Init 10
72.032 --> 50.975 --> 40.080 --> 38.525 --> 38.274 --> 38.274 -->
Init 11
68.385 --> 39.940 --> 38.525 --> 38.274 --> 38.274 -->
Init 12
71.264 --> 54.645 --> 53.469 --> 50.041 --> 47.748 --> 47.367 --> 45.471 --> 40.415 --> 38.274 --> 38.274 -->
Init 13
68.948 --> 56.189 --> 55.228 --> 51.461 --> 47.355 --> 40.913 --> 39.228 --> 38.525 --> 38.274 --> 38.274 -->
Init 14
70.825 --> 39.433 --> 38.274 --> 38.274 -->
Init 15
69.938 --> 53.940 --> 53.139 --> 51.893 --> 51.337 --> 51.337 -->
Init 16
73.047 --> 57.085 --> 55.936 --> 54.749 --> 52.264 --> 45.080 --> 39.497 --> 38.525 --> 38.274 --> 38.274 -->
Init 17
69.231 --> 50.839 --> 41.550 --> 38.274 --> 38.274 -->
Init 18
68.292 --> 58.990 --> 56.241 --> 53.241 --> 45.728 --> 40.138 --> 38.274 --> 38.274 -->
Init 19
69.969 --> 40.015 --> 38.274 --> 38.274 -->
Init 20
69.511 --> 51.434 --> 48.272 --> 47.017 --> 45.178 --> 40.415 --> 38.274 --> 38.274 -->
# Author: Romain Tavenard
# License: BSD 3 clause

import numpy
import matplotlib.pyplot as plt

from tslearn.clustering import KernelKMeans
from tslearn.datasets import CachedDatasets
from tslearn.preprocessing import TimeSeriesScalerMeanVariance

seed = 0
numpy.random.seed(seed)
X_train, y_train, X_test, y_test = CachedDatasets().load_dataset("Trace")
# Keep first 3 classes
X_train = X_train[y_train < 4]
numpy.random.shuffle(X_train)
# Keep only 50 time series
X_train = TimeSeriesScalerMeanVariance().fit_transform(X_train[:50])
sz = X_train.shape[1]

gak_km = KernelKMeans(n_clusters=3,
                      kernel="gak",
                      kernel_params={"sigma": "auto"},
                      n_init=20,
                      verbose=True,
                      random_state=seed)
y_pred = gak_km.fit_predict(X_train)

plt.figure()
for yi in range(3):
    plt.subplot(3, 1, 1 + yi)
    for xx in X_train[y_pred == yi]:
        plt.plot(xx.ravel(), "k-", alpha=.2)
    plt.xlim(0, sz)
    plt.ylim(-4, 4)
    plt.title("Cluster %d" % (yi + 1))

plt.tight_layout()
plt.show()
Total running time of the script: (0 minutes 1.073 seconds)